Retention Rate
| First-year cohort entering in: | Percent returning the next Fall |
|---|---|
| Fall 2023 | 90% |
| Fall 2022 | 87% |
| Fall 2021 | 87% |
| Fall 2020 | 86% |
| Fall 2019 | 87% |
| Fall 2018 | 90% |
| Fall 2017 | 91% |
| Fall 2016 | 91% |
| Fall 2015 | 89% |
Source: IPEDS Fall Enrollment Survey.
Graduation Rates
| Percent graduating within | ||||
|---|---|---|---|---|
| First-year cohort entering in: | 4 years | 5 years | 6 years | 8 years |
| Fall 2020 (Class of 2024) | 72% | |||
| Fall 2019 (Class of 2023) | 74% | 80% | ||
| Fall 2018 (Class of 2022) | 74% | 82% | 82% | |
| Fall 2017 (Class of 2021) | 77% | 83% | 84% | |
| Fall 2016 (Class of 2020) | 79% | 83% | 84% | 85% |
| Fall 2015 (Class of 2019) | 78% | 80% | 81% | 81% |
| Fall 2014 (Class of 2018) | 78% | 81% | 82% | 82% |
| Fall 2013 (Class of 2017) | 80% | 83% | 84% | 85% |
| Fall 2012 (Class of 2016) | 78% | 81% | 81% | 81% |
| Fall 2011 (Class of 2015) | 80% | 84% | 85% | 85% |
| Fall 2010 (Class of 2014) | 81% | 84% | 84% | 84% |
| Fall 2009 (Class of 2013) | 79% | 82% | 83% | 84% |
| Fall 2008 (Class of 2012) | 78% | 82% | 83% | 84% |
Source: IPEDS Graduation Rate Survey, 200% Graduation Rate Survey.
Student Right-to-Know Act Disaggregated Six-Year Graduation Rates
Percent graduating within 150% of normal time (i.e., six years or less)
| First-year cohort entering in: | |||||||||||
|---|---|---|---|---|---|---|---|---|---|---|---|
| Fall 2008 | Fall 2009 | Fall 2010 | Fall 2011 | Fall 2012 | Fall 2013 | Fall 2014 | Fall 2015 | Fall 2016 | Fall 2017 | Fall 2018 | |
| All students | 83% | 83% | 84% | 85% | 81% | 84% | 82% | 81% | 84% | 84% | 82% |
| Gender | |||||||||||
| Men | 79% | 82% | 82% | 85% | 78% | 84% | 76% | 78% | 85% | ||
| Women | 85% | 84% | 85% | 85% | 83% | 84% | 86% | 83% | 83% | ||
| Race and ethnicity | |||||||||||
| American Indian or Alaska Native | ** | ** | n/a | n/a | n/a | n/a | n/a | ** | n/a | ||
| Asian | 81% | 81% | 86% | 85% | 81% | 83% | 78% | 85% | 92% | ||
| Black or African American | 92% | 89% | 91% | 76% | 72% | 79% | 85% | 79% | 88% | ||
| Hispanic | 93% | 74% | 88% | 88% | 90% | 90% | 81% | 76% | 88% | ||
| Native Hawaiian or Other Pacific Islander | n/a | n/a | ** | n/a | n/a | ** | n/a | ** | n/a | ||
| Two or more races | 80% | n/a | 76% | 87% | ** | 76% | 88% | 53% | 100% | ||
| White | 82% | 85% | 84% | 85% | 80% | 83% | 82% | 82% | 82% | ||
| Race and ethnicity unreported | 64% | 74% | 81% | 86% | 76% | 87% | ** | ** | 75% | ||
| Nonresident alien | 92% | 87% | 77% | 74% | 90% | 85% | 88% | 93% | 84% | ||
| Financial aid received Fall semester, first year |
|||||||||||
| Federal Pell Grant | 79% | 89% | 88% | 95% | 93% | 87% | 78% | 88% | |||
| Direct Subsidized Loan, no Pell Grant | 84% | 85% | 85% | 79% | 85% | 83% | 85% | 80% | |||
| Neither Pell Grant nor Direct Subsidized Loan | 84% | 82% | 84% | 79% | 81% | 80% | 80% | 84% | |||
Source: IPEDS Graduation Rate Survey. Rates for cells with n<10 are suppressed (**); "n/a" indicates there were no students in that category.
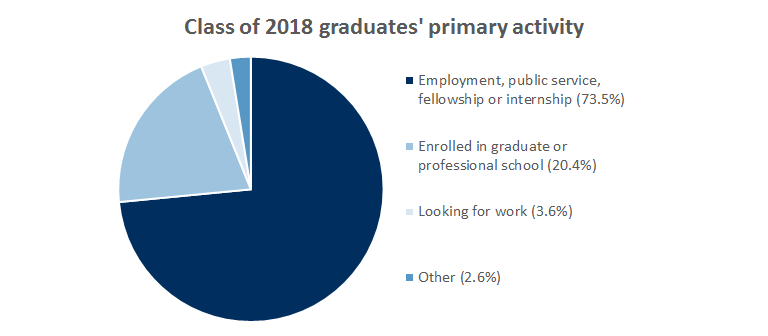
Employment, Graduate and Professional School
| Top employers | Top graduate schools |
|---|---|
| Connecticut College | Columbia University |
| Brigham and Women's Hospital | New York University |
| Cravath, Swaine & Moore LLP | Brandeis University |
| Fulbright | Imperial College London |
| JLL | Pace University |
| Tufts Medical Center | University of Connecticut |
| University of Rhode Island |
Source: Class of 2018 One Year Out Survey. See also the Class of 2017 One Year Out Survey, Class of 2016 One Year Out Survey, Class of 2015 One Year Out Survey, Class of 2014 One Year Out Survey and Class of 2013 One Year Out Survey.
For longer-term analyses, see the Class of 2013 Five-Year-Out Study, showing the employment and education activities of Connecticut College students who had been out of college for five years. In addition, a detailed analysis of the Classes of 2007-2009 indicates that nearly half of them had completed a graduate or professional degree within about a decade after graduating from Connecticut College. For full details, see our Ten Year Out Graduate Degree Completions Report.